Until the twentieth century, infectious diseases were the proximate cause of almost all human illness and death. Improvements in sanitation, widespread vaccination, and the advent of antibiotics began to turn the tide against the once intractable causative agents of these pathologies; bacteria and viruses. Major achievements of vaccination against globally endemic viral infections include the eradication of smallpox (transmitted by the variola virus) in 1980, which is estimated to have caused approximately 300 million deaths in the twentieth century;1 likewise, the WHO is close to realizing its goal of the eradication of polio (transmitted by the poliovirus).2 While the bacterial disease diphtheria caused 15,000 deaths in the United States in 1921, there were only two confirmed cases between 2004 and 2014.3 Nevertheless, developments in recent years (including rising antibiotic resistance and declines in rates of vaccination in the developed world) threaten to undermine some of the advances that have been made. Outbreaks of preventable measles in the U.S. in 2014 and 2017 exemplify some of the troubling consequences of these trends.
Measles, also known as rubeola (not to be confused with rubella or “German measles,” an unrelated disease), is an infectious disease caused by Measles morbillivirus, and was estimated to be responsible for 2.6 million deaths worldwide annually as recently as 1980. Successful vaccination efforts have reduced this number to 134,200 in 2015,4 yet this still amounts to more vaccine-preventable deaths than any other disease.5
The measles virus, transmitted by inhalation of airborne droplets, is among the most infectious viruses known, with a 90% probability of transmission per susceptible exposure.6 By comparison, the risk of transmission of HIV by needle-sharing with an infected source is 0.63% per exposure.7 Once the measles virus enters the body, the course of pathogenesis includes an incubation period of 10-14 days; this is followed by a prodromal period characterized by fever, cough, conjunctivitis (pink eye), and coryza (stuffy nose), and then an exanthem (rash) phase in which the body is covered by a raised, reddish rash. Usually, the exanthem subsides within 4 days, and after a 10-14 day recovery period, the infected individual will subsequently have lifelong immunity to the virus.
Potentially life-threatening complications can sometimes arise as a consequence of measles infection, including pneumonia and encephalitis (which can lead to permanent deafness and/or intellectual disability).8 According to the CDC, one or two out of every 1,000 children who get measles will die as a result of the infection. A rare long-term complication is subacute sclerosing panencephalitis (SSPE), an incurable disease of the central nervous system that develops up to 7-10 years after infection, and causes progressive, debilitating brain damage; SSPE is invariably fatal, causing death within 1-3 years of diagnosis.9,10
Before the development of the measles vaccine in 1963 by Maurice Hilleman and his team, there were approximately 500 deaths out of 500,000 cases each year in the United States.11 Due to the success of the vaccine, there were a record low annual total of 37 cases reported in 2004. As of today, all U.S. states require that children entering public schools receive two doses of the measles vaccine, given as part of the MMR (measles, mumps, rubella) vaccine (which is combined in order to minimize the number of vaccinations required and improve compliance). Since pregnant and nursing mothers pass on antibodies to their offspring trans-placentally (IgG) and through breast-feeding (IgA), a child born to a mother who is immune to measles (through prior infection/vaccination) will acquire passive immunity to measles which lasts for roughly six months after birth. Accordingly, the first dose of the vaccine is recommended at 12-18 months, while the second is given either at 6-7 years or by entry into Kindergarten.
The current form of measles vaccine is a live attenuated vaccine (LAV), in other words, an isolated strain of the live measles virus which has been weakened by continued propagation under specific host conditions. Earlier forms of the vaccine included a dead/inactivated virus, but it was ultimately found not to offer adequate long-term protection. The vaccine is 95% effective; out of 100 individuals who are vaccinated, 5 will not be adequately protected and will be susceptible to future infection.12
In 1998, the prestigious medical journal, The Lancet, published a paper by British gastroenterologist Andrew Wakefield and colleagues that claimed to provide evidence of a link between MMR vaccination and a combination of gastrointestinal and behavioral disorders (which Wakefield termed “autistic enterocolitis,” now recognized as a “nonexistent” medical condition). In a widely publicized press conference, Wakefield argued that the use of the combined MMR vaccine rather than single vaccines given separately played a causal role in the development of the condition.13 In 2004, an investigative journalist discovered that prior to the publication of the paper, Wakefield had received more than £400,000 from lawyers seeking to file a lawsuit against vaccine manufacturers, and that he had applied for a patent to an alternative single dose vaccine; furthermore, it was found that Wakefield had manipulated the data presented in the paper, falsifying evidence retrieved from patients.
In 2010, The Lancet retracted the paper; soon after, Wakefield was barred from medical practice in the UK.14 Nevertheless, the controversy (fueled largely by news media reporting and the popular press) has had lasting consequences; MMR vaccination compliance in the UK dropped from 92% in 1996 to 85% in 2006, the same year in which the country saw its first measles death since 1992. In 2011, the U.S. had 220 cases, its largest outbreak since 1996; 89% of those who contracted the disease had not been vaccinated. The U.S. had a record number of 667 cases in 27 states in 2014, the most since 2000;14 the disease was especially prevalent among an Amish community in Ohio after two unvaccinated Amish men had returned from a trip to do relief work in the Philippines.15
A 2017 outbreak in Minnesota was concentrated among a community of Somali immigrants. The largest outbreak since 1990, there are (as of this writing) 48 confirmed cases (46 are children 10 and younger, 41 are Somali-American, and 45 were unvaccinated) but officials believe that up to 7,000 people may have been exposed; there have been 11 hospitalizations, and the response has cost the state of Minnesota $207,000. Vaccination rates in several Minnesota counties have recently fallen below 90%, and they are especially low among the Somali community hardest hit. According to the Washington Post, the community had been heavily courted by anti-vaccine activists, who organized meetings that included Andrew Wakefield himself. In an interview, Wakefield said “The Somalis had decided themselves that they were particularly concerned. I was responding to that.”16,17,18
As misperceptions about vaccination and infectious disease persist, and as some use the outbreak to stoke fears of refugees,19 it’s more important than ever to appreciate the factors responsible for such outbreaks. The use of mathematics to model the spread of infectious disease is an increasingly critical tool, not just for epidemiologists and health care providers; a simple mathematical model can offer a powerful means of effectively communicating the speed and scope of potential outbreaks of infectious disease.
The classic models of the spread of infectious disease are compartment models, so-called because they involve the use of compartments of individuals organized by infective status (e.g. susceptible, infectious, recovered). Shiflet and Shiflet describe the use of the SIR and SEIR models (with the SEIR model also referred to as the “Lipsitch model,” after its developer, Marc Lipsitch) to simulate the spread of SARS (severe acute respiratory syndrome).20 The models are named according to the compartments (populations) used:
Susceptibles (S) have no immunity from the disease.
Infecteds (I) have the disease and can spread it to others.
Exposed (E) have the disease but are not yet infectious.
Recovereds (R) have recovered from the disease and are immune to further infection.
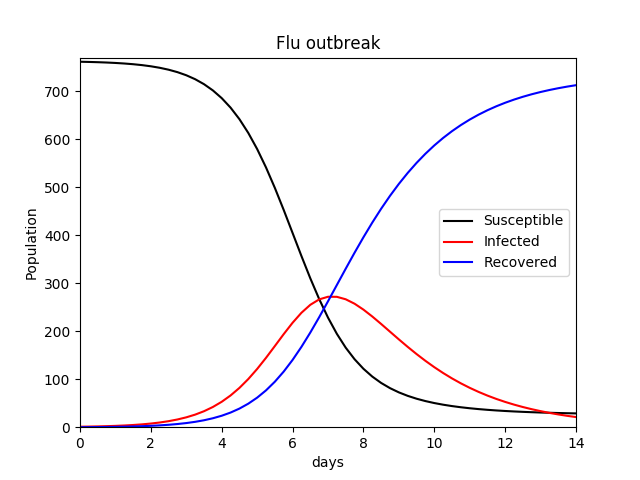
This author recreated the simple SIR model with his own code (I have used β for the transmission constant and r for the recovery rate) using values given in the text (Equation set 4.3.1, page 135, Shiflet & Shiflet), to apply to a hypothetical flu outbreak as a proof of concept. Parameters and values used are listed below:
The equations governing the changes in the respective compartments are shown below (Equation set 1). The results can be seen in Figure 1.
(1) 
A more complex model is the MSEIR model, which involves two additional compartments; a population M of those with Maternally-derived passive immunity, and a population E of “exposed” individuals who have been infected (e.g. with the measles virus) but are currently in a latent incubation period and thus are not infective and will not transmit the disease to others (at least not yet). While the above demonstration of the SIR model was extremely simplified (i.e. a constant population was assumed), vital dynamics may be included that the total population can fluctuate over time according to birth and death rates. This is especially relevant to a model that includes a population compartment of newborn individuals who are temporarily immune to infection. Such a model is described in great depth by Hethcote (2000).21 A diagram/flow chart is shown in Figure 2.
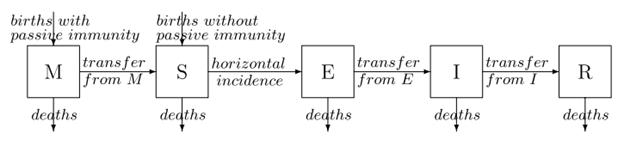
Reprinted from Hethcote, Herbert (2000). “The Mathematics of Infectious Diseases”. SIAM Review 42(4):599-653 doi: 10.1137/S0036144500371907.
The MSEIR model includes the transmission constant β (which Hethcote clarifyingly calls the contact rate), and the following parameters; N is the total number of individuals in the population; 1/δ which is the average period of passive immunity; 1/ε which is the average latent period; 1/γ which is the average infectious period; R0, the basic reproductive number; σ the contact number,and R the replacement number. Vital dynamics for the total population include b, the birth rate, and d the death rate.
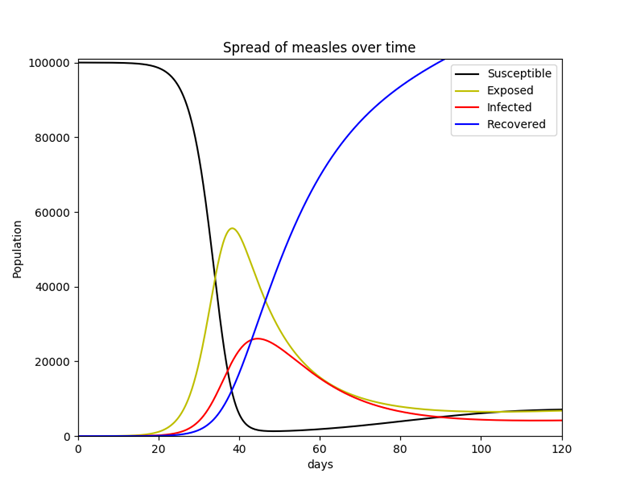
In order to validate implementation of Hethcote’s description of the MSEIR model using Python 2.7.11, a simpler SEIR model was initially tested. While this model (like the SIR model) may incorporate vital dynamics, it was decided to use a constant population. This simplified model simulates the hypothetical scenario in which a population of 100,000 susceptible individuals suddenly includes a single infective individual with measles. The model assumes no births or deaths, and no individual ever enters or exits the population once the simulation begins. This seemingly unrealistic situation is at least somewhat evocative of what took place when Europeans first entered and colonized the Americas (outbreaks of infectious diseases originating in the Old World, such as small pox, were responsible for the deaths of as much as 80-90% of the pre-Columbian indigenous population within a span of 200 years).22 The equations used for this simplified SEIR model are listed in Equation Set 2.
(2) 
Parameters are listed below with known values for measles disease. The latent (incubation) period for measles is 10-14 days (the average 12 was used). An individual is most contagious from the last day of incubation (the 12th day in this case) through 7 additional days thereafter (3 days of a prodromal period and 4 days of the exanthem phase, or for 4 days before and after the exanthem/rash appears, as described above), thus, the average infectious period is 8 days.
After much trial and error, this author ultimately chose not to utilize R0, σ, and R, improvising instead by developing two additional parameters: let k be the number of contacts an infected person has per day, let j be the probability of transmission of the virus per adequate contact (i.e. between an infected and a susceptible). Then  .
.
Going with a value previously given by Shiflet & Shiflet (2014), it was decided to use 33.3 contacts per day (p. 134), as well as a probability of viral transmission of 0.9 (which is the actual probability of measles transmission as described above).
S = 99,999 (total number of susceptible individuals)
E = 0 (total number of exposed/latent individuals)
I = 1 (total number of infected/infective individuals)
R = 0 (total number of recovered/immune individuals)
N = S + E + I + R (total number of individuals in the population)
k = 33.3 (contacts an infected person has per day)
j = 0.9 (probability of transmission of the virus per adequate contact)
β = kj/N = 0.0002977 (contact rate; rate of adequate contacts)
1/ε = 12 days (average length of latent period)
1/γ = 8 days (average length of infective period)

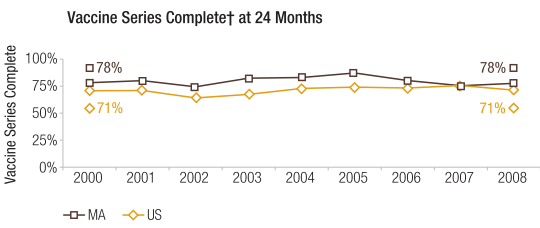
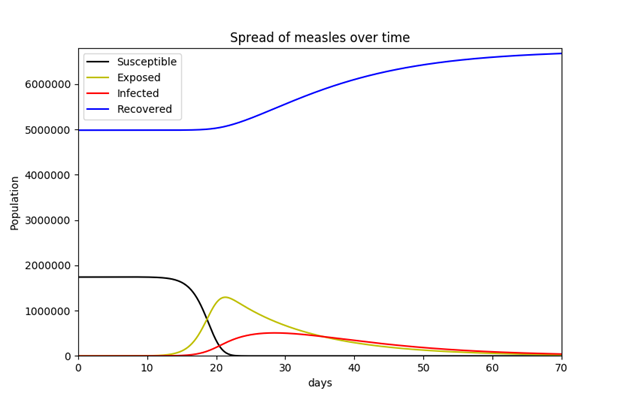
For the MSEIR model, available population data for the commonwealth of Massachusetts were used in order to incorporate vital dynamics. The state’s estimated total population as of 2015 was 6,794,422.23 The total numbers of births and deaths for 2015 were 71,492 and 55,200 respectively.24 Since there were 71,492 births in the commonwealth in 2015, the author decided to simply use this for the initial number of individuals in the maternally-derived passive immunity compartment population. As mentioned above, the average length of maternally-derived passive immunity is 3 months (approximately 180 days), so 1/δ is 180 days. According to the Department of Public Health, while Massachusetts has one of the highest levels of immunization in the country, the percent of children who had completed the vaccine series by age 24 months in 2008 was 78% (Figure 4).25 This requirement is met if the child is vaccinated with ≥ 1 measles-containing vaccine and ≥ 1 measles-containing vaccine/MMR (among other vaccines). While the percentage of the state’s population that has measles immunity is certainly higher than 78%, this percentage was used to obtain the number of recovered (immune) individuals for the purposes of this model. Since the vaccine is 95% effective, the number of recovered individuals is 0.95 × 0.78 × 6,794,422. The relevant equations were obtained from Hethcote (2000).
(3) 
All parameters and values used are listed below:
N = 6,794,422 (total number of individuals in the population)
M = 71,492 (total number of individuals with maternally-derived passive immunity)
R = 0.95 × 0.78 × 6,794,422 (total number of recovered/immune individuals)
S = N – R – S (total number of susceptible individuals)
E = 0 (total number of exposed/latent individuals)
b = 71,492 / N (total birth rate)
d = 55,200 / N (total death rate)
k = 33.3 (contacts an infected person has per day)
j = 0.9 (probability of transmission of the virus per adequate contact)
β = kj/N = 0.0002977 (contact rate; rate of adequate contacts)
1/ε = 12 days (average length of latent period)
1/γ = 8 days (average length of infective period) 1/δ = 180 days (average length of maternally-derived passive immunity)
References:
- Koplow, David A. (2003). Smallpox: the fight to eradicate a global scourge. Berkeley: University of California Press. ISBN 0-520-24220- Retrieved from http://www.who.int/about/bugs_drugs_smoke_chapter_1_smallpox.pdf
- “Polio This Week”. Global Polio Eradication Initiative. Retrieved from http://polioeradication.org/polio-today/polio-now/this-week/
- “What Would Happen If We Stopped Vaccinations?”. Centers for Disease Control and Prevention. Retrieved from https://www.cdc.gov/vaccines/vac-gen/whatifstop.htm
- “Measles Fact Sheet: Reviewed March 2017”. World Health Organization. Retrieved from http://www.who.int/mediacentre/factsheets/fs286/en/
- Kabra, SK; Lodhra, R (14 August 2013). “Antibiotics for preventing complications in children with measles”. Cochrane Database of Systematic Reviews. 8: CD001477. doi:10.1002/14651858.CD001477.pub4. PMID 23943263.
- Chen, S; Fennelly, G (10 Nov 2016). “Measles: Practice Essentials”. Medscape. Retrieved from http://emedicine.medscape.com/article/966220-overview
- “HIV Risk Behaviors: Estimated Per-Act Probability of Acquiring HIV from an Infected Source, by Exposure Act”. Centers for Disease Control and Prevention. Retrieved from https://www.cdc.gov/hiv/risk/estimates/riskbehaviors.html
- Kayser Fritz H, Bienz Kurt A, Eckert Johannes, Zinkernagel Rolf M, eds. (2005). Color Atlas of Microbiology. New York: Thieme. pp. 465-467 ISBN 1-58890-245-5.
- “Measles (Rubeola): Complications of Measles”. Centers for Disease Control and Prevention. Retrieved from https://www.cdc.gov/measles/about/complications.html
- “Subacute sclerosing panencephalitis”. MedlinePlus. Retrieved from https://medlineplus.gov/ency/article/001419.htm
- Hambrosky Jennifer, Kroger Andrew, Wolfe Charles, eds. (2015). Epidemiology and Prevention of Vaccine-Preventable Diseases, 13th edition: The Pink Book. Centers for Disease Control and Prevention. Washington D.C. Public Health Foundation. ISBN 978-0-9904491-1-9.
- Minor, Philip D (May 2015). “Live attenuated vaccines: Historical successes and current challenges”. Virlogy 479-480: 379-392. doi: 10.1016/j.virol.2015.03.032
- Moore Andrew (2006). “Bad science in the headlines: Who takes responsibility when science is distorted in the mass media?”. EMBO reports. 7 (12): 1193–1196. doi:10.1038/sj.embor.7400862.
- Meikle, James; Boseley, Sarah (24 May 2010). “MMR row doctor Andrew Wakefield struck off register”. The Guardian. London.
- Gastañaduy PA, Budd J, Fisher N, et al. (6 Oct 2016). “A Measles Outbreak in an Underimmunized Amish Community in Ohio”. N Engl J Med. 375(14):1343-1354. doi: 10.1056/NEJMoa1602295
- Sun, Lena H (5 May 2017). “Anti-vaccine activists spark a state’s worst measles outbreak in decades”. The Washington Post. Retrieved from https://www.washingtonpost.com/national/health-science/anti-vaccine-activists-spark-a-states-worst-measles-outbreak-in-decades/2017/05/04/a1fac952-2f39-11e7-9dec-764dc781686f_story.html
- Howard, Jacqueline (8 May 2017). “Measles outbreak strikes Minnesota’s Somali community”. CNN. Retrieved from http://www.clickondetroit.com/news/national/measles-outbreak-strikes-minnesotas-somali-community
- Mele, Christopher (5 May 2017). “Minnesota Sees Largest Outbreak of Measles in Almost 30 Years”. New York Times. Retrieved from https://www.nytimes.com/2017/05/05/us/measles-minnesota-vaccines.html
- Wilkins, Alasdair (8 May 2017). “Right Wing Tries To Seize On Minnesota Somali Measles Outbreak”. Vocativ. Retrieved from http://www.vocativ.com/427779/right-wing-minnesota-somali-measles-outbreak/
- Shiflet, Angela; Shiflet, George (2014). Introduction to Computational Science: Modeling and Simulation for the Sciences, Second Edition. Princeton: Princeton University Press. pp. 131-146. ISBN 9781400850556
- Hethcote, Herbert (2000). “The Mathematics of Infectious Diseases”. SIAM Review 42(4):599-653 doi: 10.1137/S0036144500371907
- Aufderheide Arthur C.; Rodríguez-Martín, Conrado; Langsjoen, Odin (1998). The Cambridge encyclopedia of human paleopathology. Cambridge University Press. p.205. ISBN 0-521-55203-6
- “Quick Facts: Massachusetts”. United States Census Bureau. Retrieved from https://www.census.gov/quickfacts/table/PST045216/25
- “Life Stages and Populations: State and Territorial Data”. National Center for Health Statistics: Centers for Disease Control and Prevention. Retrieved from https://www.cdc.gov/nchs/fastats/state-and-territorial-data.htm
- “Health of Massachusetts”. (April 2010). Massachusetts Department of Public Health. Boston, MA. Retrieved from http:// www.mass.gov/dph/healthofmassachusetts